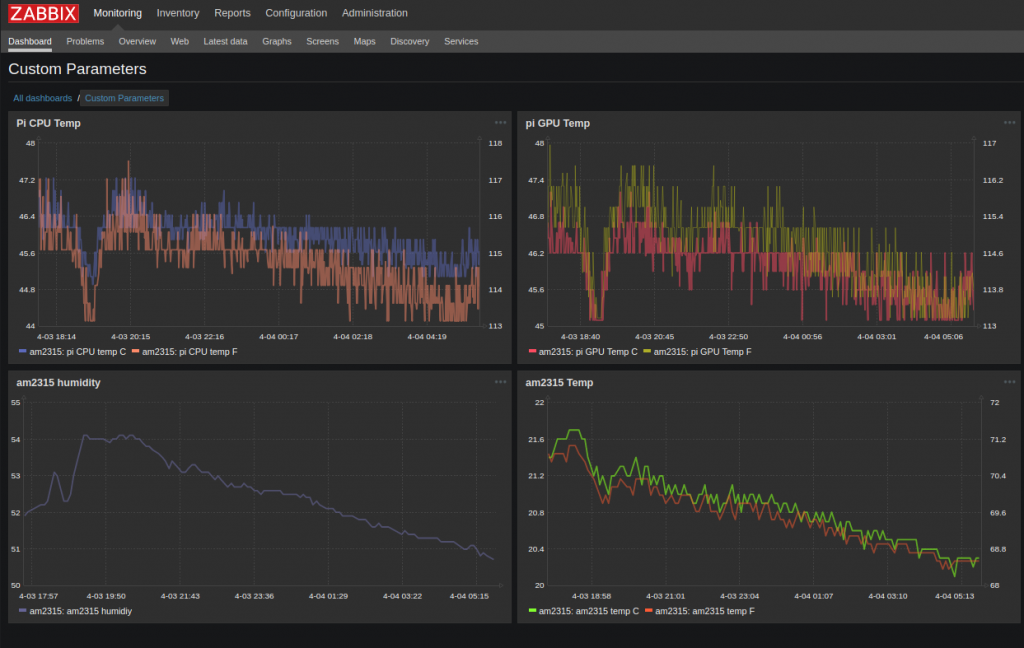
This is part three of the ‘How-To‘ series on leveraging the Zabbix IT monitoring platform using a Raspberry Pi. Part-1 showed how to install the Zabbix server on a Pi. Part-2 showed how to get the Zabbix agent running on a Pi. In this post, I show how to graph the CPU and GPU temperature of a Pi and the temperature/humidity readings from a precision AM2315 temperature sensor.

The Zabbix platform is incredibly flexible. It allows nearly endless possibilities of tracking and graphing data using custom User-Parameters. This is very useful to Makers since it allows the monitoring of sensor data on custom dashboards.
You can download the ‘How-To’ document here. I have also provided a zip file containing the custom scripts and agent configuration user parameter section on the downloads page.
Let me know how you use the Zabbix platform with your Pi fleet to monitor and track sensor data.
